
Introducing the Newest Online Marketing Tool for the Multifamily Industry: The Respage PPC Dashboard
Keeping track of the finer details of a PPC campaign is hard work, especially if you have multiple properties and Ad Groups. So after seeing how ecstatic our clients were about using the Respage SEO Dashboard when we released it in the beginning of the year, we decided to build a similar tool for PPC campaigns. Now, after months of grueling design and development, we’re proud to announce that the newest online marketing tool for apartments is finally available. Without further ado, here’s a page by page look at this revolutionary new product from Respage:
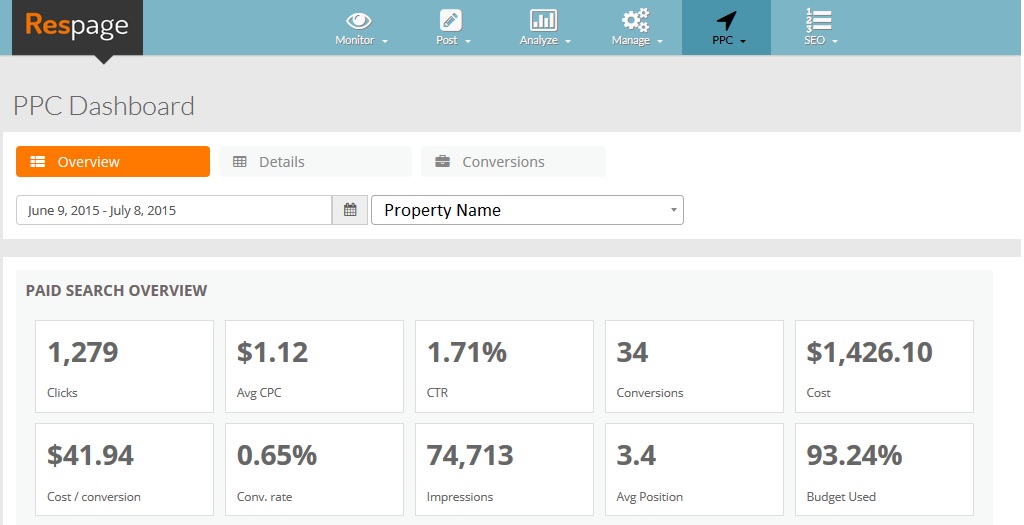
The Overview Page
The dashboard opens on the Overview page, which provides you with a birds-eye-view of your entire campaign. While detailed summaries of each property’s Key Performance Indicators can be found on other pages of the PPC Dashboard, this page was designed to bring you simple data points for lightning-fast campaign evaluation. Quickly assess your most pertinent information, like Average Ad Position, Total Clicks, Total Conversions, and more, all within a sleek interface that’s unpretentious and easy to understand.
In addition to this top grid of quick statistics, we’ve also included other key takeaways that allow you to rapidly analyze your overall campaign. Check out how bid pricing influences overall spend with our Total Clicks Vs. Cost graph, or get detailed information about your top performing Ad Groups, Ads, and Keywords with our Top Performers charts.
The Details Page
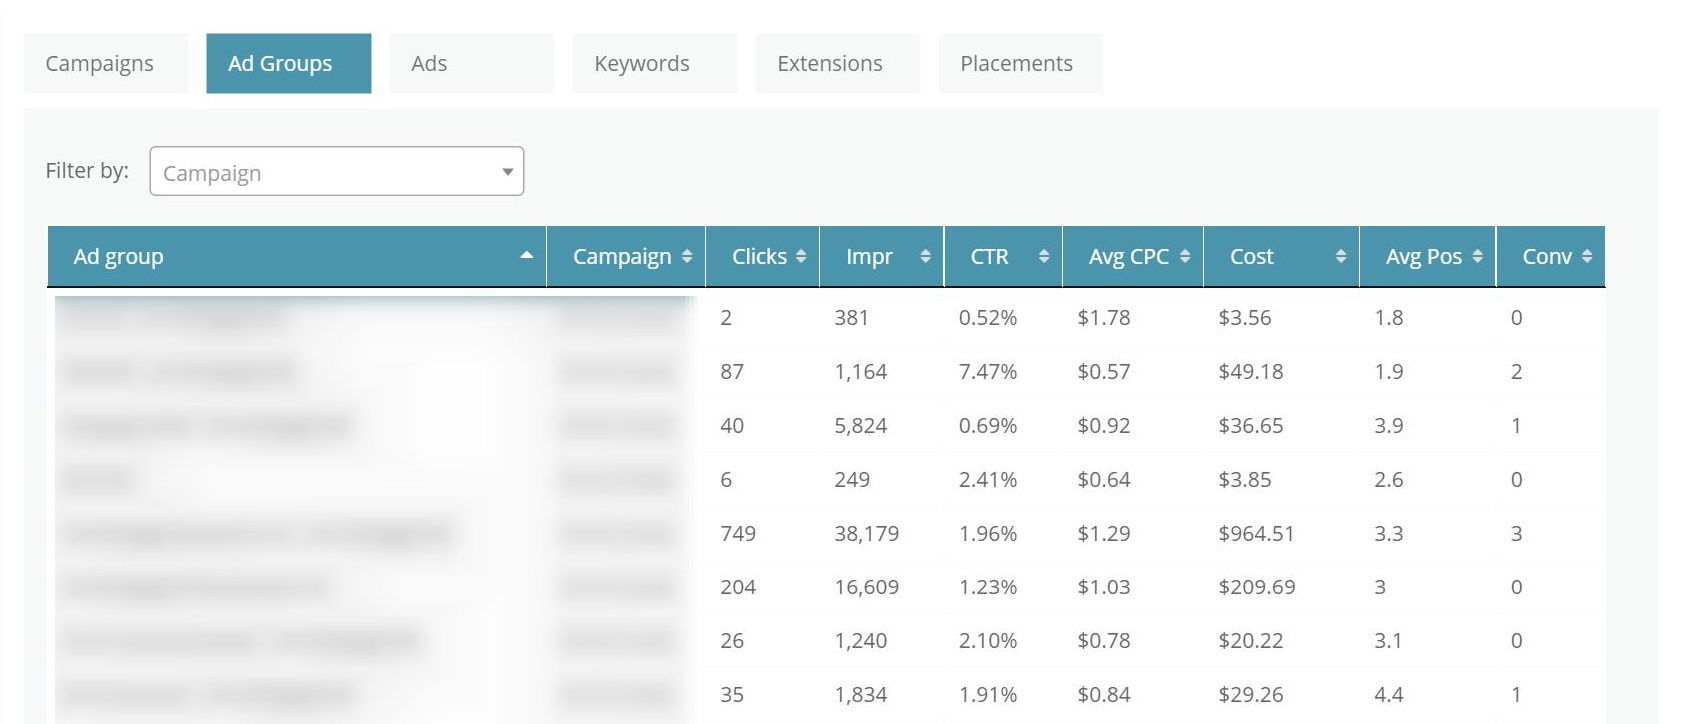
At Respage, we know that it’s all about the details when it comes to effective online marketing for the multifamily industry. That’s why the Details page of our PPC Dashboard breaks down all of your data on a property by property level. Want to see which properties get the most impressions or the highest CTRs? You can do that. Want to see which keyword extensions increase your chances of a conversion? You can do that, too.
Full details can be broken down by Ad Groups, Ads, Keywords, Extensions, and Placements. Each of these categories provides you with data regarding Clicks, Impressions, CTR, Average CPC, Overall Cost, Average Position, and Conversions.
The Conversions Page
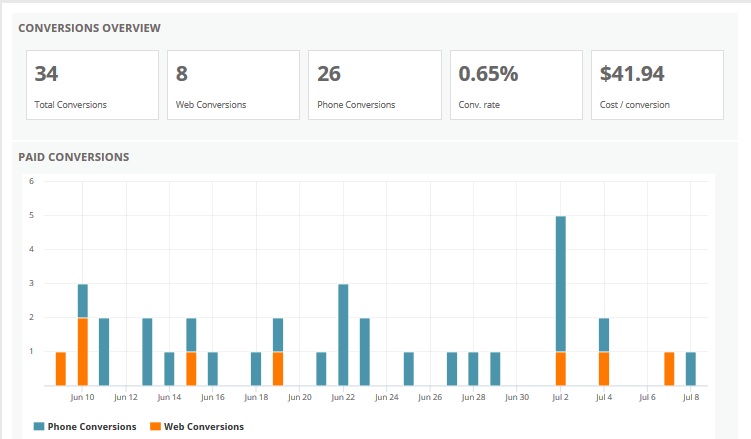
What value is an online marketing strategy if you can’t prove it’s leading to lease signings? To ensure that you get the most out of our PPC Dashboard, we’ve included an entire tab solely dedicated to conversions. Similar to the Overview page, the top of the Conversions page displays key takeaways from your entire campaign, including Total Conversions, Web Conversions, Phone Conversions, average Conversion Rates, and the average Cost per Conversion. Further down the page, users will find a bar graph that charts web and phone conversions for each day of the week.
See it in Action
To discover how the Respage PPC Dashboard can lower vacancy rates for your apartment communities, and to learn more about our other services, contact one of our representatives to schedule a live demo today!