Respage Express Launches Improved Google Analytics Reporting
If you’ve logged onto Respage Express lately, you’ve probably noticed that we have some new and improved features to really help you harness the power of social media. One of those updates includes better analytics reporting.
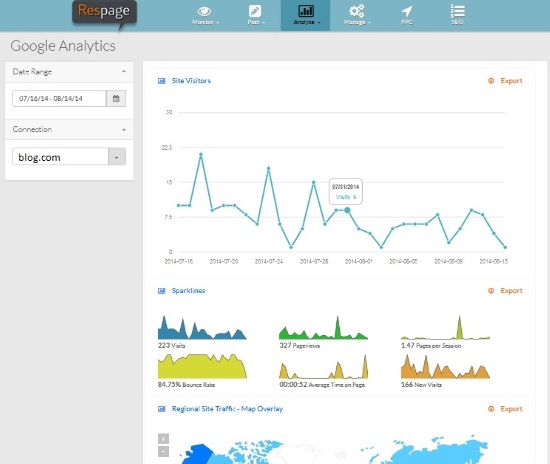
Now when you visit the “Analyze” section of Respage Express and select “Google Analytics,” you’ll see a wealth of easy-to-read statistics with helpful graphics to help you better analyze how your blog or website is performing. You’ll still be able to view how many visitors came to your site each day, and updates include Pageviews, Pages per Session, Bounce Rate, Average Time on Page, New Visits, Regional Site Traffic, Traffic Sources, and Top Content.
If you’re compiling a report or you need to send the data to one of your colleagues, you can also export each section into a handy CSV file. The “Top Content” section will even allow you to search for a particular word or phrase and allow you to select from the top 10, 25, 50, or 100 entries. Essentially, you’ll have all the helpful Google Analytics data and tools you want all in one great dashboard.
Have questions? Want to learn more? Get in touch!


